
Many nations around the world have agreed to protect 30% of the land and sea by the year 2030.
But there are conflicting ideas about which areas should be protected. Natural History Museum scientists are using global biodiversity data to try and get a better idea as to which regions would provide an outsized contribution to the health of our planet.
The Earth is facing a two-sided emergency.
On the one hand there is the unfolding climate crisis, in which the unmitigated release of greenhouse gases into the atmosphere has already started to increase the frequency and severity of floods, wildfires and droughts.
To try and curb this, most nations have signed up to the Paris Agreement. This is an international treaty on climate change to keep the rise in mean global temperatures to “well below” 2°C above pre-industrial levels. Progress on this has been slow. Countries come together every year to take stock on progress, with the latest meeting taking place during COP28 in Dubai.
But the other emerging issue is the biodiversity crisis. This is the dramatic and damaging decline of nature being replicated around the globe, which is seeing the loss of species, habitats and ecosystems at an unprecedented rate.
Driven by land-use change, over exploitation and urbanization, the biodiversity crisis has historically been overlooked but is now gaining attention among governments and policymakers. If the planet loses too much biodiversity, the future health and survival of millions of people around the world will be put at risk.
For example, the destruction of coastal mangrove forests is not only a loss for the wildlife that lives within them, but also increases the risk of severe flood events for people living in the same region.
What’s being done to tackle biodiversity?
One proposed solution to the biodiversity crisis is an initiative called 30 by 30 (also written as 30×30).
The idea is that in order to preserve biodiversity at healthy levels, governments should designate 30% of land and ocean as protected areas by the year 2030. To date, over 100 nations have signed up to this initiative which has now been adopted as a formal target within the Convention on Biological Diversity international treaty.

The initiative has not, however, been universally accepted. There are concerns that if the 30% to be protected is not sensitively identified and enforced, it could lead to the persecution and forced displacement of indigenous peoples in the name of protecting the world’s wildlife.
Professor Andy Purvis is a lead researcher at the Natural History Museum who is spear-heading the use of data to model how biodiversity responds to human pressures.
“Every country has places that are important for the delivery of ecosystem services, and for species conservation, but these aren’t necessarily in the same place,” explains Andy. “Protected areas are often found in unpopulated places, but the sites that are most important for ecosystem services are often shared by people and nature.”
“So, if 30×30 focuses solely on preventing species extinctions in remote areas, then it could be a disaster for ecosystem services that people depend on. We must ensure that nature is given a look in where people live and protect 30% of these places too.”
What is needed is more targeted information and data which can give a clearer picture of what land should be considered under the 30 by 30 scheme.
How is biodiversity faring?
In order to better protect the planet’s biodiversity, governments and policymakers first need to know where exactly the natural environment is doing well and where it is suffering the most. This can then inform which areas should be covered by 30×30.
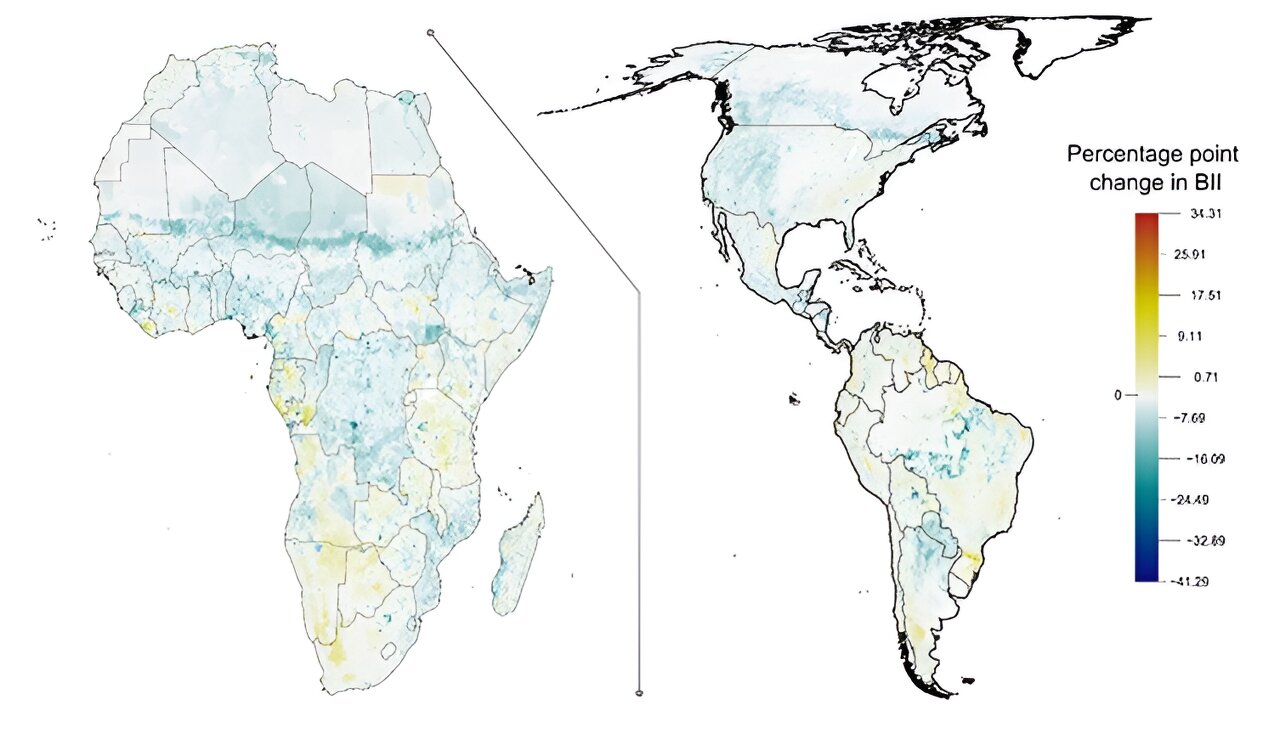
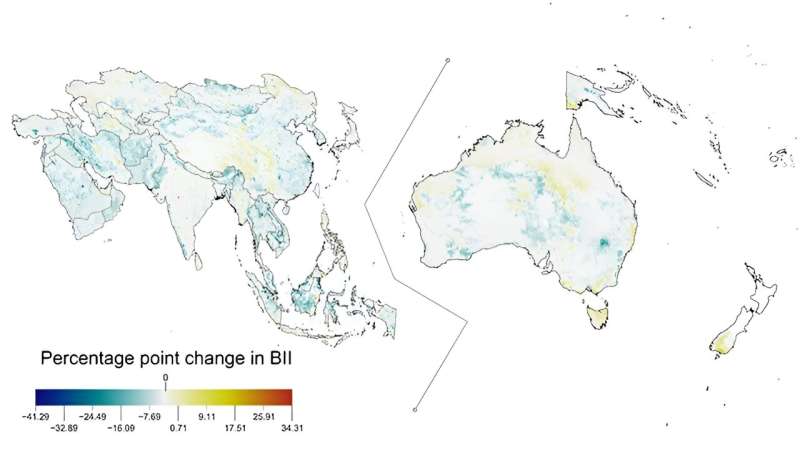
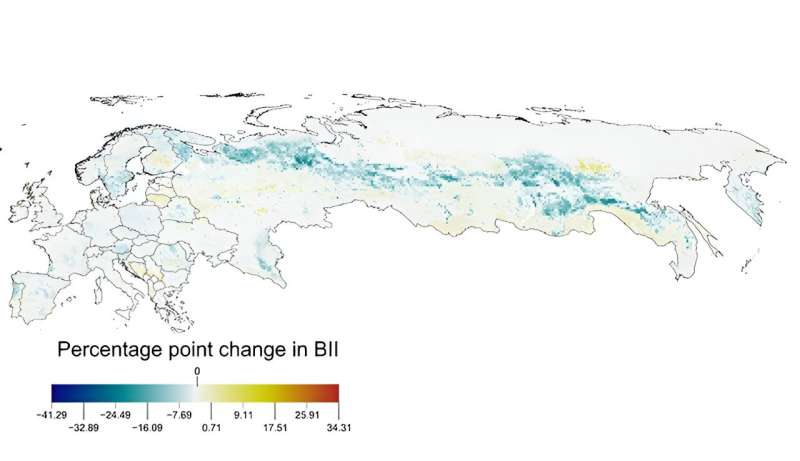
To try and answer these critical questions, Andy and his team have developed a tool known as the Biodiversity Intactness Index. At its essence, this is a measure of how the health of the natural world is faring at any one place during any one year going back to 2000.
By using a wide range of data from thousands of scientific studies looking at how species—including everything from mammals, birds, insects and plants—are doing worldwide, the team can infer a baseline of biodiversity for different regions. This creates an estimated percentage of the original number of species and their abundance that remains in any given area.
This then allows the researchers to compare, year on year, how the natural world is managing. This gives a much clearer picture of where nature is doing well and increasing, and where it is doing poorly and decreasing.
As always, there are a few caveats in this approach. For example, in those places which had already destroyed much of their biodiversity before the twentieth century, like Western Europe, the data typically shows that there has been little change in the state of nature simply because it is starting from an already low baseline. Additionally, smaller countries usually show a steeper decline in biodiversity because there are fewer places for plants and animals to go in those nations.

By focusing on where biodiversity is highest, such as the hills of the Western Ghats of south-western India, and where it is most at risk, policy makers could maximize the number of species protected by the 30×30 scheme.
But some scientists are concerned that this doesn’t show the full picture.
Where should we protect?
The Biodiversity Intactness Index shows that protected areas work. The tool has established that within the borders of reserves and parks, nature has declined at a slower rate than in those areas outside these boundaries.
This is clearly good news, but does little to answer the question of where the new protected areas should go under the developing 30×30.
There is an increasing awareness that certain natural features, such as mountain glaciers or mangrove swamps, have an outsized contribution to providing ecosystem services that are critical for the survival of people. For example, particular grasslands might be the perfect habitat for crucial pollinating insects on which our agricultural crops depend, or peat bogs that are able to help mitigate extreme fluctuations in rainfall.
Known as ‘critical natural assets,” these environments might not be the most biodiverse in any given country and are often intermingled with human populations who rely on them, but they also provide wider services that protect our own health and well-being. Unfortunately, they often fall outside of protected areas and are at risk of being destroyed.
Dr. Adriana de Palma, a Senior Researcher in the research team at the Natural History Museum, says, “It’s often implicit that discussions of 30×30 are about species conservation, so we want to feed into that debate by seeing how protected areas are currently contributing to people and the benefits they receive.”
“If we keep choosing protected areas in the way we previously have, then we’re putting people at risk. And we can’t be complacent about this.”
What is now needed is more data at a better resolution to understand what these critical natural assets are, where they can be found, and how they interact with the areas of land already designated as under some form of protection.
It is then hoped that governments and policy makers will be better equipped to make more informed decisions as to which parts of the planet need our strongest protections.
Provided by
Natural History Museum
This story is republished courtesy of Natural History Museum. Read the original story here.
Citation:
How do we know which parts of the planet to protect? (2023, December 11)
retrieved 11 December 2023
from https://phys.org/news/2023-12-planet.html
This document is subject to copyright. Apart from any fair dealing for the purpose of private study or research, no
part may be reproduced without the written permission. The content is provided for information purposes only.


